

World Coins Mystery Box Coolstax Vault


Cantore Arithmetic is able to state word trying.
1. Crazy Horse doctor and Dr. Ziegler.
Cantore Arithmetic is not interested in NASA. The words applicable are word accurate and your journey so[thus] fare[long] has been word equated word theft. This word Common denominator equated words[worth] long pause[Pause.].
1. Now in Sacramento I had a experience that drove home the word paranoid as at Dorchester with words address 815 bowel boa the worth to words is whoa.
2. My mother had a nervous breakdown and had to Europe while E.Kp junior had a divorce, the paranoia equated word doctors.
The fact that word Diagnosis is word select[Safeway] is word simply complex. Now, the fact that computers are not available and a laptop is a word dance studio the Doctor in Sacramento needed[Boudin] as 22 22nd Avenue is word gone, the Farm is word gone, the word security is word gone and this is not what word they had equated with word applied. So, now that it seems that Cantore Arithmetic is not needed the deeper this goes[Dr. Byron Kilgore] the more that that Doctor needs to be accommodated[Dr. Luis Vuksinick, MD].
Word virtue[Virtue] is a keyboard that is made to direct in other words I am on the computer and my fingers are typing and keys are antibiotic so that word worry does not inhabit word antibiotic but rather embraces the crutch. The entire keyboard is set to word design in word Probability as you are not meant to loose hope:
You searched for
"VIRTUE" in the KJV Bible
6 Instances - Page 1 of 1 - Sort by Book Order - Feedback
- 2 Peter 1:5chapter context similar meaning copy save
- And beside this, giving all diligence, add to your faith virtue; and to virtueknowledge;
- Luke 8:46chapter context similar meaning copy save
- And Jesus said, Somebody hath touched me: for I perceive that virtue is gone out of me.
- Luke 6:19chapter context similar meaning copy save
- And the whole multitude sought to touch him: for there went virtue out of him, and healed them all.
- Mark 5:30chapter context similar meaning copy save
- And Jesus, immediately knowing in himself that virtue had gone out of him, turned him about in the press, and said, Who touched my clothes?
- 2 Peter 1:3chapter context similar meaning copy save
- According as his divine power hath given unto us all things that pertain unto life and godliness, through the knowledge of him that hath called us to glory and virtue:
- Philippians 4:8chapter context similar meaning copy save
- Finally, brethren, whatsoever things are true, whatsoever things are honest, whatsoever things are just, whatsoever things are pure, whatsoever things are lovely, whatsoever things are of good report; if there be any virtue, and if there be any praise, think on these things.
1. Word Here goes;
Monday, February 29, 2016
Venn diagram
From Wikipedia, the free encyclopedia
Part of a series on Statistics Probability theory
- Venn diagram
- Tree diagram
Contents
[hide]Example[edit]
This example involves two sets, A and B, represented here as coloured circles. The yellow circle, set A, represents all living creatures that are two-legged. The blue circle, set B, represents the living creatures that can fly. Each separate type of creature can be imagined as a point somewhere in the diagram. Living creatures that both can fly and have two legs—for example, parrots—are then in both sets, so they correspond to points in the area where the blue and orange circles overlap. That area contains all such and only such living creatures.Humans and penguins are bipedal, and so are then in the orange circle, but since they cannot fly they appear in the left part of the orange circle, where it does not overlap with the blue circle. Mosquitoes have six legs, and fly, so the point for mosquitoes is in the part of the blue circle that does not overlap with the orange one. Creatures that are not two-legged and cannot fly (for example, whales and spiders) would all be represented by points outside both circles.The combined area of sets A and B is called the union of A and B, denoted by A ∪ B. The union in this case contains all living creatures that are either two-legged or that can fly (or both).The area in both A and B, where the two sets overlap, is called the intersection of A and B, denoted by A ∩ B. For example, the intersection of the two sets is not empty, because there are points that represent creatures that are in both the orange and blue circles.History[edit]
Venn diagrams were introduced in 1880 by John Venn in a paper entitled On the Diagrammatic and Mechanical Representation of Propositions and Reasonings in the "Philosophical Magazine and Journal of Science", about the different ways to represent propositions by diagrams.[1][2] The use of these types of diagrams in formal logic, according to Ruskey and M. Weston, is "not an easy history to trace, but it is certain that the diagrams that are popularly associated with Venn, in fact, originated much earlier. They are rightly associated with Venn, however, because he comprehensively surveyed and formalized their usage, and was the first to generalize them".[3]Venn himself did not use the term "Venn diagram" and referred to his invention as "Eulerian Circles".[2] For example, in the opening sentence of his 1880 article Venn writes, "Schemes of diagrammatic representation have been so familiarly introduced into logical treatises during the last century or so, that many readers, even those who have made no professional study of logic, may be supposed to be acquainted with the general nature and object of such devices. Of these schemes one only, viz. that commonly called 'Eulerian circles,' has met with any general acceptance..."[1] The first to use the term "Venn diagram" was Clarence Irving Lewis in 1918, in his book "A Survey of Symbolic Logic".[3]Venn diagrams are very similar to Euler diagrams, which were invented by Leonhard Euler in the 18th century.[note 1] M. E. Baron has noted that Leibniz (1646–1716) in the 17th century produced similar diagrams before Euler, but much of it was unpublished. She also observes even earlier Euler-like diagrams by Ramon Lull in the 13th Century.[4]In the 20th century, Venn diagrams were further developed. D.W. Henderson showed in 1963 that the existence of an n-Venn diagram with n-fold rotational symmetry implied thatn was a prime number.[5] He also showed that such symmetric Venn diagrams exist when n is 5 or 7. In 2002 Peter Hamburger found symmetric Venn diagrams for n = 11 and in 2003, Griggs, Killian, and Savage showed that symmetric Venn diagrams exist for all other primes. Thus rotationally symmetric Venn diagrams exist if and only if n is a prime number.[6]Venn diagrams and Euler diagrams were incorporated as part of instruction in set theory as part of the new math movement in the 1960s. Since then, they have also been adopted in the curriculum of other fields such as reading.[7]Overview[edit]
See also: Set (mathematics) § Basic operations
Extensions to higher numbers of sets[edit]
Venn diagrams typically represent two or three sets, but there are forms that allow for higher numbers. Shown below, four intersecting spheres form the highest order Venn diagram that has the symmetry of a simplex and can be visually represented. The 16 intersections correspond to the vertices of a tesseract (or the cells of a 16-cell respectively).
Edwards' Venn diagrams[edit]
Other diagrams[edit]
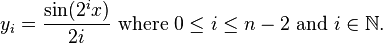
Edwards' Venn diagrams are topologically equivalent to diagrams devised by Branko Grünbaum, which were based around intersecting polygons with increasing numbers of sides. They are also 2-dimensional representations of hypercubes.Henry John Stephen Smith devised similar n-set diagrams using sine curves[11] with the series of equations
Related concepts[edit]
Venn diagrams correspond to truth tables for the propositions,
, etc., in the sense that each region of Venn diagram corresponds to one row of the truth table.[12][13] Another way of representing sets is with R-Diagrams.
Subscribe to: Posts (Atom)


No comments:
Post a Comment